


What if that three-digit number is quietly adding thousands to your loan costs?
The credit score chart (300–850) is the map lenders use to set rates and decide approvals.
This post explains each score band, how FICO and VantageScore differ, and what your score actually means for mortgages, auto loans, and cards.
You’ll get clear thresholds, like what counts as “good” versus “very good”, and one-page steps you can use now to raise your score.
No fluff, just the trade-offs and the first moves to lower your costs.
Understanding the Full Credit Score Chart Range (300–850)

The credit score chart runs from 300 to 850. Both FICO and VantageScore use this scale to measure how risky you are as a borrower. FICO built this range more than 25 years ago, and it still drives over 90% of lending decisions, from mortgages and auto loans to credit cards and personal financing. The chart splits borrowers into five categories based on how they handle payments, manage debt, and build credit history. Right now, about 20% of Americans score 800 or higher, while the national average hovers around 706 to 710.
Each category tells lenders something different. The top tier, 800 to 850, signals you’re an exceptional credit manager with minimal risk. The 740 to 799 band marks you as a very good prospect. Good credit sits between 670 and 739, covering near-average consumers. Fair credit spans 580 to 669, where approvals get conditional and rates climb. Anything below 580 lands in the poor category, where your options narrow fast and costs spike.
| Score Range | Category | Meaning |
|---|---|---|
| 800–850 | Exceptional | Top-tier borrower; best available rates and terms |
| 740–799 | Very Good | Low risk; strong approval odds with favorable rates |
| 670–739 | Good | Average risk; access to mainstream financing at moderate rates |
| 580–669 | Fair | Higher risk; approvals often require conditions or higher down payments |
| 300–579 | Poor | High risk; limited options and highest costs |
Lenders read these ranges as probability indicators. An exceptional or very good score tells an underwriter you’re unlikely to miss payments. A fair or poor score signals elevated default risk, which usually means tighter terms or a flat no. The chart gives both sides a shared reference point for credit access and cost.
Comparing FICO and VantageScore Credit Score Charts

FICO powers more than 90% of credit decisions. VantageScore, created by the three major credit bureaus, offers an alternative that uses the same 300 to 850 scale but applies slightly different category labels and weighting. Both pull from the same data, your payment records, balances, credit age, account types, and recent applications, but they combine those inputs differently.
The result? Your FICO and VantageScore numbers can differ by 10 to 30 points even when pulled the same day. Lenders almost always pull FICO for underwriting, so that’s the number you should watch when you’re prepping for a loan or refinance. VantageScore pops up more in consumer apps and monitoring dashboards because it can generate a score with less account history than FICO needs.
| Model | Excellent | Good | Fair | Poor/Very Poor |
|---|---|---|---|---|
| FICO | 800–850 | 670–799 | 580–669 | 300–579 |
| VantageScore | 781–850 | 661–780 | 601–660 | 300–600 |
What Each Credit Score Range Means for Borrowing Power

Where you sit on the credit score chart shapes every piece of your financial access. Exceptional scores, 800 and above, unlock the lowest advertised APRs, waived origination fees, and instant approvals on premium rewards cards. Lenders see these borrowers as profit centers with minimal risk, so they compete for the business. Very good scores, 740 to 799, get nearly identical treatment. You’ll qualify for the same rate tiers and promotional offers.
Good scores, 670 to 739, land you in the middle. You’ll get approved for most mainstream products, but you won’t see the teaser rates. Expect APRs a percentage point or two higher on auto loans and mortgages. Credit card issuers will approve you for standard products but may hold back sign-up bonuses and elevated credit limits for higher scorers. This is where small improvements matter. Moving from 680 to 720 can shave thousands off a 30-year mortgage.
Fair scores, 580 to 669, mean conditional approval. Mortgage lenders might ask for 10% or 15% down instead of 3%, and your APR will be noticeably higher. Auto lenders will approve you but often at subprime rates. Credit card options narrow to secured cards or high-fee unsecured products. This range has the most improvement potential. Consistent on-time payments and lowering utilization can lift you 30 to 60 points in six to twelve months.
Poor scores, below 580, restrict access sharply. Many prime lenders won’t touch you. You’ll rely on subprime auto lenders, secured credit products, or co-signers. Rental applications may require extra deposits, and some employers run credit checks that can affect hiring for finance-sensitive roles. The upside? Every positive action counts here. Even small moves can produce visible score gains within a few months.
Mortgages: Exceptional and very good scores qualify for conventional loans at published rates. Good scores add 0.5 to 1% to the APR. Fair scores often require FHA products or larger down payments. Poor scores face denials or hard-money alternatives.
Auto loans: Top-tier borrowers access promotional 0 to 3% APR offers. Good scorers pay mid-single-digit rates. Fair scorers enter subprime territory at 10 to 15%. Poor scorers may pay 18% or more.
Credit cards: Exceptional scorers unlock premium travel and cash-back cards with large bonuses. Good scorers qualify for mid-tier rewards cards. Fair scorers receive secured or high-fee unsecured products. Poor scorers have limited options beyond secured cards or authorized-user arrangements.
Personal loans: Exceptional and very good borrowers receive single-digit APRs and fast approval. Good borrowers pay 10 to 15%. Fair borrowers pay 18 to 25%. Poor borrowers face high-cost installment loans or denial.
Refinancing: High scorers can refinance whenever they want to capture rate drops. Good scorers qualify but may not save enough to justify closing costs. Fair and poor scorers often can’t refinance without paying points or accepting short-term balloon structures.
How a Credit Score Chart Is Calculated: The Five Core Factors

FICO builds your three-digit score by weighing five data categories pulled from your credit report. Each factor carries a different percentage of influence, and the model updates every time a lender, creditor, or collection agency reports new information to the bureaus. Understanding the weights helps you figure out where to focus when you’re trying to move up the chart.
Payment History
Payment history accounts for 35% of your FICO score. The single largest factor. The model tracks whether you paid each account on time, how many times you missed payments, how late those payments were, and how recently the delinquencies occurred. A single payment that crosses the 30-day late threshold can drop your score by as much as 100 points if your credit file is otherwise clean. “Before I set up autopay, I forgot one credit card due date and watched my score fall from 780 to 695 in a single reporting cycle.”
Credit Utilization
Utilization represents 30% of your score and measures how much of your available revolving credit you’re using. The formula is simple: total balances divided by total credit limits. If you’ve got a $10,000 combined limit across all cards and carry $5,000 in balances, your utilization is 50%. Scores respond best when you keep utilization below 15%, and ideally below 10%. Paying down balances or requesting limit increases both lower your ratio without changing your spending.
Length of Credit History
Credit age contributes 15% of your score. The model looks at the average age of all your accounts and the age of your oldest account. If you opened a mortgage six years ago, an auto loan two years ago, and a credit card ten years ago, your average is roughly six years. Closing that ten-year card would shorten your average and potentially lower your score. Keep long-held accounts open even if you no longer use them daily, as long as they don’t carry annual fees.
Credit Mix
Account variety makes up 10% of your score. Lenders prefer to see that you can manage both revolving credit, like credit cards and lines of credit, and installment loans such as mortgages, auto loans, or student debt. You don’t need every type of account, but having at least one of each signals broader financial competence. Adding a small installment loan or a secured card can help if your file is thin.
New Credit & Hard Inquiries
Recent credit activity accounts for the final 10%. Every time you apply for new credit and the lender pulls a hard inquiry, the model takes note. Multiple inquiries in a short window signal elevated risk. The good news? Mortgage, auto, and student loan shopping within a 14 to 45-day period counts as a single inquiry, so you can rate-shop without penalty. Hard inquiries influence your score for about 12 months and drop off your report entirely after 24 months.
Real Examples That Show How a Credit Score Chart Works
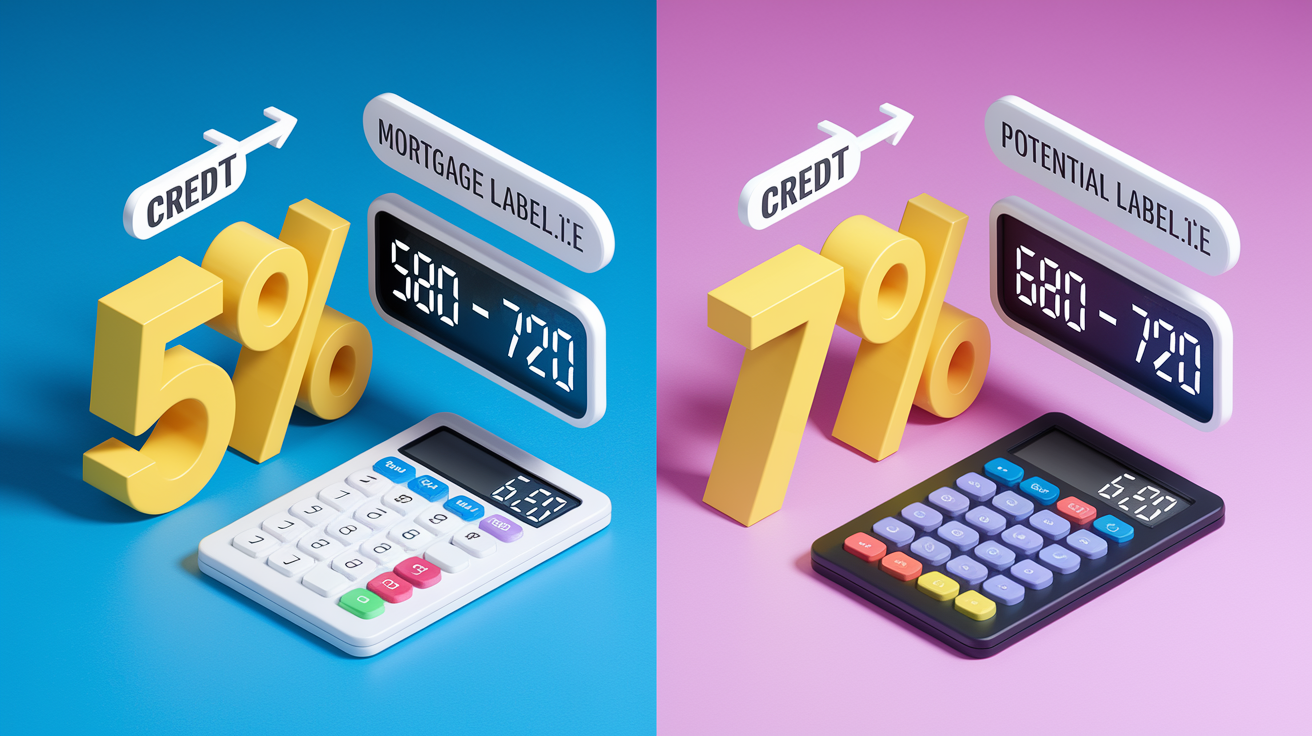
Numbers get clearer when you see them in action. Take utilization: if your credit card limit is $10,000 and you carry a $5,000 balance at statement close, your utilization is 50%. That puts downward pressure on your score. Pay the balance down to $1,500, and utilization drops to 15%, a level where the scoring model rewards you with higher points. The difference between 50% and 15% utilization can move a fair-range score into the good range within one or two reporting cycles.
Mortgage rate tiers show how the chart translates to real costs. A borrower with an exceptional score, say 820, might lock a 30-year fixed mortgage at 6.5% APR. A good-range borrower at 690 could face 7.2%, and a fair-range borrower at 620 might see 8.5% or higher. On a $300,000 loan, that 2-percentage-point spread costs an extra $360 per month, or roughly $130,000 over the life of the loan.
Utilization calculation: $10,000 total limit, $5,000 balance = 50% utilization. Target below 15% means keeping the balance under $1,500.
Mortgage APR tiers: Exceptional score (800+) qualifies at 6.5%. Good score (690) pays 7.2%. Fair score (620) receives 8.5%, adding $360/month on a $300,000 loan compared to the top tier.
Credit card approval likelihood: Exceptional and very good scorers gain instant approval for premium rewards cards with $10,000+ limits. Good scorers qualify for mid-tier products with $3,000 to $7,000 limits. Fair scorers receive secured or high-fee cards with $500 to $1,500 limits. Poor scorers face denial or must post collateral.
Tracking Your Credit Score Chart Over Time

You’re entitled to one free credit report per year from each of the three major bureaus, Equifax, Experian, and TransUnion, through annualcreditreport.com. Pulling all three at once gives you a complete snapshot and lets you spot reporting errors that might be dragging down your score. About 5% of consumers find mistakes serious enough that correcting them improves their credit access or lowers their rates. Common errors include accounts that don’t belong to you, late payments incorrectly reported, or balances that should’ve been marked paid.
Daily score-monitoring tools have become widely available, often at no cost through credit card issuers or financial apps. These tools use soft inquiries, which don’t affect your score, and update weekly or monthly. Monitoring helps you catch fraud early, unauthorized accounts or inquiries that signal identity theft, and track the impact of your own actions. If you pay down a card or open a new account, you’ll see the score change within one or two billing cycles.
Negative items like late payments, collections, and charge-offs can stay on your report for up to seven years. Hard inquiries remain visible for two years but stop influencing your score after 12 months. Bankruptcies linger longer. Chapter 7 for ten years, Chapter 13 for seven. That timeline means patience is part of the process, but it also means the clock is always running. Even serious negatives eventually age off and stop hurting you.
Pull all three bureau reports annually to identify and dispute errors. Stagger them every four months if you want continuous monitoring throughout the year.
Use a free daily-score tool from your bank or card issuer to track changes and catch fraud quickly.
Set calendar reminders to review account activity monthly and confirm all reported balances and payments match your records.
File disputes immediately when you spot inaccuracies. Bureaus must investigate within 30 days, and corrections often happen faster than expected.
Improving Your Position on the Credit Score Chart
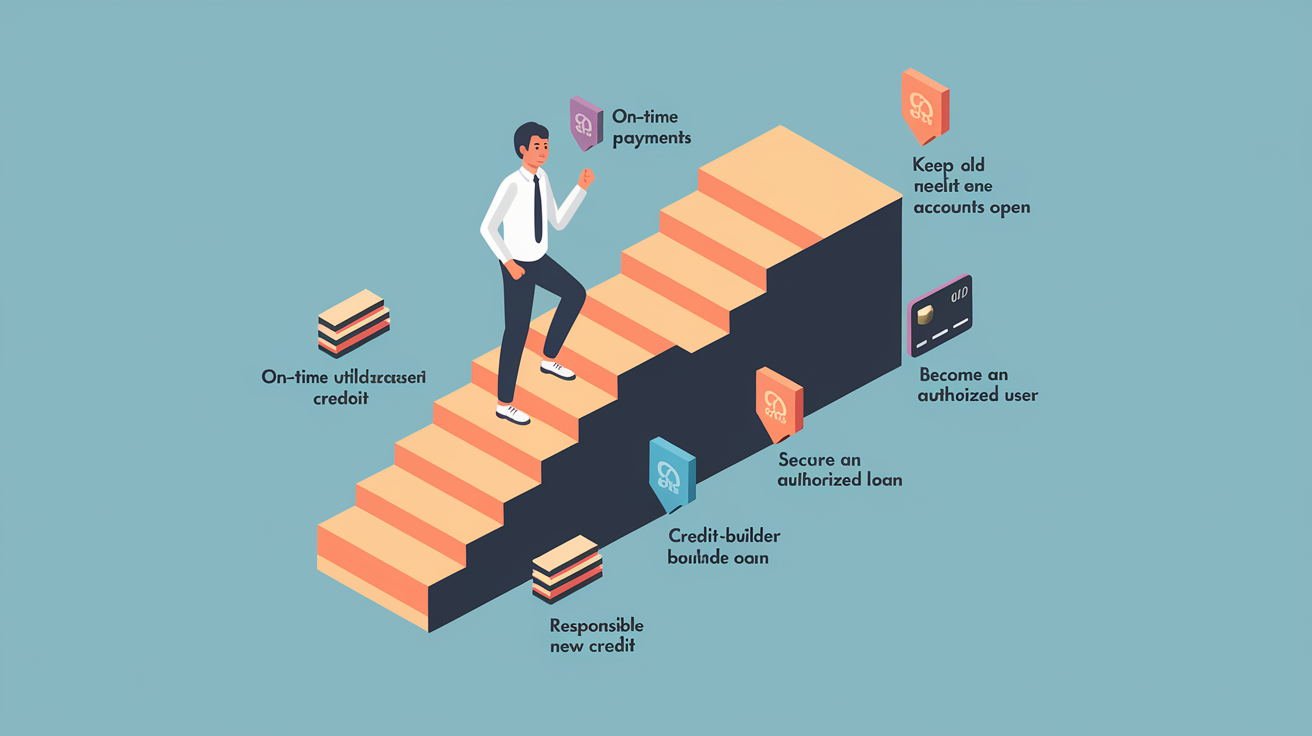
On-time payments remain the highest-leverage action you can take. A single payment that crosses 30 days late can cost you up to 100 points, so automating at least the minimum due on every account eliminates that risk entirely. Align due dates with your paychecks if possible, and contact creditors immediately if you expect to miss a payment. Many will work with you to avoid reporting a delinquency.
Lowering utilization to 15% or below produces visible score gains within one or two statement cycles. You can do this by paying down balances, making multiple payments per month to keep the reported balance low, or requesting credit limit increases after an income bump. Some issuers grant automatic increases every six to twelve months if you stay current. Spreading balances across multiple cards also helps, since the model looks at both overall and per-card utilization.
Keeping old accounts open preserves your average credit age. If an account has no annual fee and you’re not tempted to overspend, leave it active with a small recurring charge, like a streaming subscription, and set autopay. Closing a ten-year-old card can shorten your average age immediately and lower your score, especially if it’s your oldest account.
Open a secured credit card if you’re building from scratch or recovering from a major negative. Many issuers graduate you to unsecured after 6 to 12 months of on-time payments.
Consider a credit-builder loan from a community bank or credit union. You make fixed monthly payments into a savings account, then receive the funds at the end, building payment history and savings at the same time.
Request credit limit increases every 6 to 12 months or after a raise. Higher limits lower your utilization ratio without requiring you to pay down balances.
Limit hard inquiries by spacing applications over time. Avoid applying for multiple cards or loans within a few weeks unless you’re rate-shopping for a mortgage or auto loan.
Become an authorized user on a family member’s long-standing, well-managed account. The account’s positive history can boost your average age and payment record.
Keep paid-off accounts open as long as they don’t carry fees. The available credit helps utilization, and the account age strengthens your history.
Common Misconceptions About Credit Score Charts
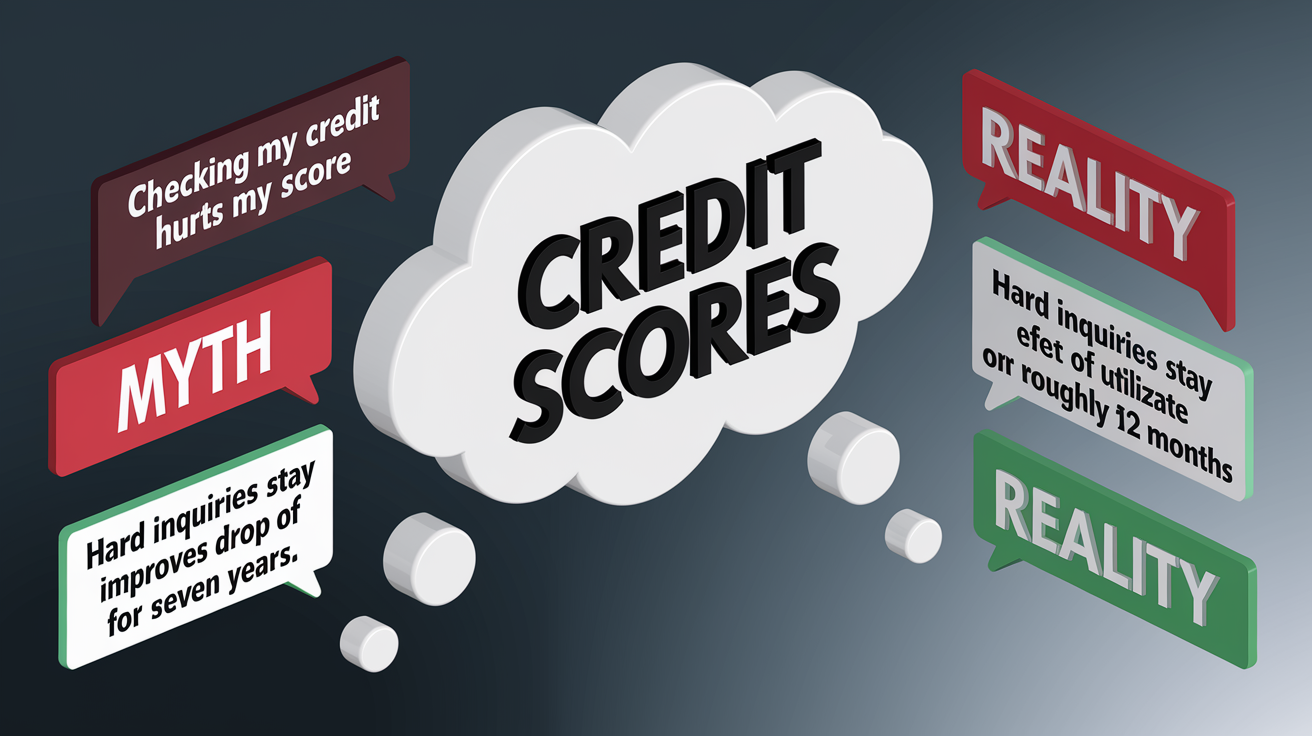
Many people believe that checking their own credit report will lower their score. It won’t. When you pull your own report or use a monitoring service, it’s classified as a soft inquiry and has zero impact on your number. Only hard inquiries, initiated by lenders when you apply for credit, can reduce your score, and even then the effect is usually small and temporary.
Another myth is that closing old accounts helps your score by reducing available credit. The opposite is true. Closing an account lowers your total credit limit, which raises your utilization ratio if you carry any balances. It also shortens your average account age once the closed account eventually drops off your report. Unless an account has a high annual fee or you’re struggling with spending control, leave it open.
Myth: Checking your own credit harms your score. Reality: Soft inquiries from self-checks or monitoring tools have no effect. Only lender-initiated hard inquiries count.
Myth: Closing old accounts improves your score. Reality: Closing accounts raises utilization and eventually shortens credit age, often lowering your score.
Myth: Hard inquiries stay on your report and hurt your score for seven years. Reality: Inquiries remain visible for two years but stop affecting your score after roughly 12 months.
Myth: Paying off a collection removes it from your report immediately. Reality: Paid collections can remain on your report for up to seven years from the original delinquency date. Paying them changes the status but doesn’t erase the record.
Final Words
You now have the 300–850 breakdown, how FICO and VantageScore differ, what each band means for borrowing power, and the five factors that move your score.
You also saw practical examples, tracking tips, and concrete steps to lower utilization, fix report errors, and build longer history.
If you only do one thing this month: make every payment on time and keep balances under 15%.
Use the credit score chart as a clear map, check it regularly, celebrate small wins, and watch your loan options and rates improve.
FAQ
Q: What is a realistic good credit score?
A: A realistic good credit score is generally 670–739 on the FICO 300–850 scale. Aim for on-time payments and credit utilization under 15% to keep that standing and lower borrowing costs.
Q: How to get 800 credit score in 45 days?
A: Getting an 800 credit score in 45 days is usually unrealistic because scores reflect longer history. Faster wins: check and dispute errors, pay down balances under 15% utilization, and avoid new credit.
Q: How rare is a 750 credit score?
A: A 750 credit score is above average and considered very good; it sits roughly in the top 20–30% of consumers, giving stronger approval odds and lower interest rates than average borrowers.
Q: What are the 5 levels of credit scores?
A: The five credit score levels are Exceptional (800–850), Very Good (740–799), Good (670–739), Fair (580–669), and Poor (300–579) on the common 300–850 scale.