


Stocks are just gambling and bonds are boring, right?
Not exactly.
Stocks give you part-ownership and aim for growth, often about 7–10% historically.
Bonds are loans that pay steady interest, usually 2–6%.
This post cuts through the noise to show the real trade-offs: when to pick stocks for long-term growth, when to use bonds for income and safety, and how to mix them based on your timeline and risk.
If you only do one thing today, pick the asset that matches how long you can wait.
Core Comparison: Understanding How Stocks and Bonds Differ

When you buy stock in a company, you’re purchasing an ownership stake in that business. You become a shareholder, which means you might receive dividends when the company distributes profits and you get to vote on certain corporate decisions. Your return comes from two sources: dividend payments (usually around 1–4% annually for established companies) and increases in the stock’s market price. The value of your shares moves up and down based on the company’s performance and overall market conditions.
Bonds work completely differently. You’re lending money to an issuer, whether that’s a government or corporation, in exchange for regular interest payments and the return of your principal when the bond matures. A typical bond has a face value of $1,000 and pays a fixed coupon rate, often in the 2–6% range annually. Unlike stocks, bonds promise specific payment amounts on set dates. That’s why they’re called fixed income securities. When the bond reaches its maturity date, the issuer pays back the original $1,000 (assuming no default).
The core distinction comes down to ownership versus lending. Stocks give you a piece of the company with variable returns that can climb or fall significantly year to year. Bonds give you creditor status with predictable interest payments but generally lower long-term returns. Historically, stocks have delivered about 7–10% annual returns over the long run, while bonds typically return around 2–6%. Stocks carry more risk because you can lose your entire investment if the company fails. Bondholders have legal priority to be repaid before shareholders.
| Feature | Stocks | Bonds |
|---|---|---|
| What you own | Equity ownership in a company | Debt instrument (you lend money) |
| Income source | Dividends (when paid) + capital gains | Interest payments (coupon) + principal at maturity |
| Typical annual return | 7–10% historically (higher volatility) | 2–6% typically (lower volatility) |
| Risk level | Higher; price can drop to $0 | Lower; creditor priority in bankruptcy |
| Rights | Voting possible; residual claim on assets | No voting; senior claim to assets |
| Best for | Long-term growth (5+ years) | Income, stability, shorter horizons |
Stock Fundamentals and How They Generate Returns
Buying stock makes you a partial owner of the company. That means you share in its success or failure. Shareholders may receive voting rights on major company decisions like electing the board of directors or approving mergers. Not all stocks pay dividends. Many growth companies reinvest all profits back into the business. But those that do typically pay out a portion of earnings every quarter. The dividend yield on most established dividend-paying stocks ranges from 1–4%, though some high-dividend stocks pay more than 5%.
Your total return from owning stock comes from two places: the dividends you collect and capital gains when you sell the shares for more than you paid. Stock prices fluctuate daily based on earnings reports, economic news, investor sentiment, and countless other factors. If you buy 100 shares at $50 each and sell them two years later at $75, you earn $25 per share in capital gains. That’s $2,500 total on your $5,000 investment. Add any dividends received during those two years, and that’s your total return.
Price volatility creates both risk and opportunity. Stocks can lose 20% or more in a bad year, but also gain 30% or more in strong years, with day-to-day price swings based on market conditions and company news. Growth potential depends on company performance. When a business increases revenue and profits, the stock price typically rises over time to reflect higher future earnings expectations.
Earnings reports move prices quickly. Quarterly results that beat or miss analyst expectations can send shares up or down by 5–10% in a single day. Market sentiment amplifies moves. During economic expansions investors push stock prices higher, during recessions fear drives them lower, often more sharply than fundamentals alone would suggest. But long-term performance averages 7–10% annually. Though individual years vary wildly, U.S. stock market history shows nominal returns in this range over multi-decade periods.
Bond Basics and Why Investors Use Fixed Income Securities
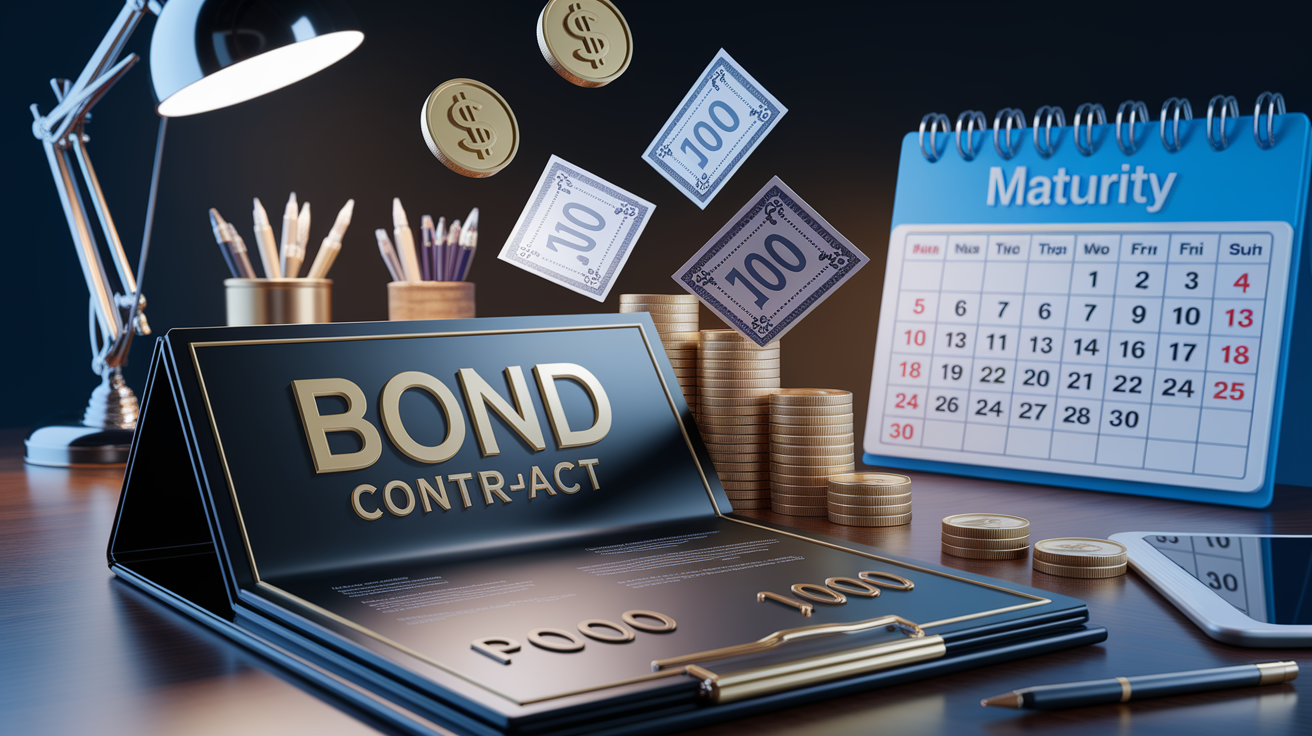
A bond is essentially an IOU with specific terms written into the contract. When issued, most bonds have a face value (also called par value) of $1,000. The issuer promises to pay you a fixed annual interest rate, called the coupon rate, which commonly ranges from 2–6% depending on the issuer’s creditworthiness and prevailing interest rates. A bond with a 5% coupon on a $1,000 face value pays $50 per year, usually split into two semiannual payments of $25. The contract also sets a maturity date, the day the issuer must repay your $1,000 principal.
Interest payments arrive on a predictable schedule until the bond matures. If you buy a 10-year bond and hold it to maturity, you receive the coupon payments every six months for ten years, then get your original $1,000 back (assuming the issuer doesn’t default). You can also sell the bond before maturity on the secondary market, where the price fluctuates based on changes in interest rates and the issuer’s credit quality. Bonds with longer maturities and lower credit ratings usually pay higher coupon rates to compensate investors for taking on more risk.
Credit ratings matter because they signal the likelihood of default, the risk that the issuer won’t make interest payments or repay principal. Agencies like Moody’s and Standard & Poor’s assign letter grades to bonds. Investment-grade bonds (rated BBB or higher) carry lower default risk and pay lower yields. High-yield bonds (rated BB or lower, often called “junk bonds”) offer higher coupons but come with meaningful risk that the issuer could fail to pay.
U.S. Treasury bonds are issued by the federal government, considered virtually risk free because the government can print money to repay debts. Typical yields are lower to reflect minimal default risk. Municipal bonds are issued by state and local governments. Interest is often exempt from federal income tax, making them attractive to higher-income investors even at lower nominal yields. Investment-grade corporate bonds are issued by financially stable companies rated BBB or higher. Yields sit between Treasuries and high-yield bonds, compensating for modest corporate default risk. High-yield corporate bonds are issued by companies with weaker credit ratings. These pay the highest coupons to offset the elevated chance of default or bankruptcy.
Key Differences: Risk, Return, and Market Behavior of Stocks vs Bonds

Stock volatility means your portfolio value can swing dramatically in short periods. In a typical year, the stock market might move up or down by 15–20%. In severe downturns stocks can lose 30% or more. That volatility reflects uncertainty about future company earnings, economic conditions, and investor psychology. When you own stock, you accept that risk in exchange for the potential to earn 7–10% annually over many years. Bonds experience much smaller price swings under normal conditions because their coupon payments are contractual obligations. A high-quality bond might fluctuate only a few percentage points in price during a year, making it far more stable for investors who can’t tolerate large losses.
Expected returns follow a trade-off. Higher potential returns come with higher risk. Stocks have historically delivered stronger long-term gains because they expose you to the full upside of business growth, but also the full downside if companies fail. Bonds deliver steadier, more predictable income. You know exactly how much interest you’ll receive and when. But that reliability comes at the cost of lower overall returns. On a risk-adjusted basis, bonds make sense when you need capital preservation or can’t afford to lose principal in the short term. Stocks make sense when you have time to ride out volatility and want your money to grow faster than inflation.
Interest rate sensitivity creates a key difference in how each asset responds to economic changes. When interest rates rise, existing bonds lose market value because new bonds offer higher coupons, making older bonds less attractive. A 10-year bond paying 3% will drop in price if new 10-year bonds start paying 4%. Stocks can also be affected by rising rates. Higher borrowing costs can hurt corporate profits. But the relationship is less direct. During economic expansions, stocks often rally while bond prices may fall as rates climb. In recessions or market panics, investors flee to the safety of bonds, driving bond prices up and yields down, while stocks get hammered. This inverse behavior is why many portfolios hold both. When one zigs, the other often zags.
| Risk Type | Impact on Stocks | Impact on Bonds |
|---|---|---|
| Market/price volatility | High; daily price swings of 1–3% common; annual swings can exceed 20% | Low for short-term bonds; moderate for long-term bonds sensitive to rate changes |
| Credit/default risk | Company bankruptcy wipes out equity; shareholders lose entire investment | Issuer default halts interest payments and may prevent principal recovery; varies by credit rating |
| Interest-rate risk | Indirect; rising rates increase borrowing costs and can hurt valuations | Direct; bond prices fall when rates rise, especially for longer maturities |
| Inflation risk | Moderate; stocks can grow with inflation over time but suffer in stagflation | High for fixed-rate bonds; purchasing power of fixed interest erodes as prices rise |
| Liquidity risk | Low for large-cap stocks; can sell shares instantly during market hours | Varies; Treasury bonds very liquid, some corporate/municipal bonds harder to sell quickly |
Ownership Rights, Legal Priority, and What Happens in Bankruptcy

Shareholders own a piece of the company, which grants certain rights but also puts them last in line if things go wrong. Common stockholders typically get one vote per share on major corporate decisions, though day-to-day control rests with the board of directors and management. If the company is sold or liquidated, shareholders receive whatever is left after all debts are paid. Which can be nothing if liabilities exceed assets.
Bondholders are creditors, not owners. That means they have no vote in company decisions but hold a senior claim on the company’s assets. When a company files for bankruptcy, bondholders stand ahead of shareholders in the priority line. Secured bondholders with collateral backing their bonds get paid first from specific assets pledged as security. Unsecured bondholders come next. Only after all bond obligations are settled do common shareholders receive anything. In most bankruptcies, common stock becomes worthless while bondholders often recover at least a portion of their principal.
The priority order from highest to lowest claim typically looks like this. Senior secured bonds are backed by specific collateral like property or equipment, first to be repaid in bankruptcy. Senior unsecured bonds aren’t backed by collateral but still senior to equity, second in line for repayment. Subordinated bonds are lower-priority debt that ranks below senior bonds but above all equity. Preferred stock is a hybrid security that pays fixed dividends and ranks above common stock but below all bonds. Common stock represents residual claimants who receive payment only after everyone else is made whole. Often recovering $0 in bankruptcy.
Time Horizons, Maturities, and Which Investment Fits Your Goals

Stocks work best when you have a long runway. At least five years, and ideally ten or more. Short-term stock volatility can leave you underwater if you need to sell during a market downturn, but over longer periods the market’s upward trend has historically smoothed out those losses. If you’re investing for retirement 20 or 30 years away, stocks give you the growth potential to build wealth and outpace inflation. The trade-off is accepting that your account balance will swing up and down year to year.
Bonds are designed to match specific timeframes through their maturity dates. Short-term bonds mature in less than three years, intermediate-term bonds in three to ten years, and long-term bonds in more than ten years (some extend to 30 years). You can choose bonds that mature around the time you’ll need the money, which reduces the risk of having to sell at a loss. If you’re saving for a down payment in four years, a bond that matures in four years locks in your principal return on a set date. Bonds also suit investors who prioritize current income over growth, such as retirees living off interest payments.
Retirement 25 years away? Allocate heavily to stocks (70–90%) to maximize long-term growth. The long horizon allows you to recover from market downturns before you need the money. House down payment in 3 years? Use short-term or intermediate bonds (or a high-yield savings account) to preserve capital. Stocks are too volatile for a fixed near-term goal.
College fund for a 10-year-old? Start with a stock-heavy mix (60–70%) and gradually shift toward bonds as college approaches. By senior year of high school, hold mostly bonds to lock in gains. Current income for living expenses? Focus on bonds or dividend-paying stocks. Bonds provide predictable quarterly or semiannual payments, while dividend stocks offer income with some growth potential but more volatility.
Building an emergency fund? Keep 3–6 months of expenses in cash or very short-term bonds (under 1 year). You need instant access and zero risk of loss, so stocks don’t belong here.
Simple Real-World Examples Showing How Stocks and Bonds Earn Money
Imagine you buy 100 shares of a company trading at $25 per share. Your initial investment is $2,500. The company pays an annual dividend of 3%, which means you receive $75 in dividend income each year ($2,500 × 0.03). Two years later, the stock price has climbed to $35 per share. If you sell all 100 shares, you collect $3,500. Your capital gain is $1,000 ($3,500 sale price minus $2,500 purchase price), and you also earned $150 in dividends over the two years. Your total profit is $1,150 on a $2,500 investment. That works out to a 46% total return, or roughly 21% annualized. Of course, the stock could have fallen to $20 instead, leaving you with a loss even after collecting dividends.
Now imagine you buy one bond with a $1,000 face value and a 4% annual coupon. The bond matures in five years. Every year until maturity, you receive $40 in interest ($1,000 × 0.04), usually paid as two $20 installments every six months. After five years, the issuer returns your $1,000 principal. If you hold the bond to maturity, your total return is $200 in interest payments ($40 per year × 5 years) plus your original $1,000. That’s a cumulative 20% gain over five years, or 4% annualized. Unlike the stock, the bond’s cash flows are predictable and contractual. You know exactly what you’ll receive and when, assuming the issuer doesn’t default.
| Example | Cash Flow | Total Return Summary |
|---|---|---|
| Stock: 100 shares at $25, sold at $35 after 2 years | Dividends: $75/year × 2 = $150 Capital gain: ($35 – $25) × 100 = $1,000 |
Total profit: $1,150 (46% total, ~21% annualized) |
| Bond: $1,000 face, 4% coupon, 5-year maturity | Interest: $40/year × 5 = $200 Principal returned: $1,000 |
Total return: $200 interest (20% over 5 years, 4% annualized) |
Choosing Between Stocks and Bonds for Your Investment Strategy

Your risk tolerance and time horizon are the two most important factors when deciding how much to put in stocks versus bonds. Risk tolerance is your ability and willingness to watch your portfolio lose value without panicking and selling. If a 20% drop would cause you sleepless nights or force you to sell at the worst time, you need more bonds to stabilize your account. Time horizon is how long until you need the money. The longer your timeline, the more risk you can take because you have years to recover from downturns. Someone investing for retirement in 30 years can ride out multiple bear markets. Someone saving for a wedding in two years cannot.
Common allocation rules offer a starting point, though they’re guidelines rather than iron laws. The classic 60/40 portfolio (60% stocks and 40% bonds) has been a balanced default for decades, aiming to capture most of the stock market’s growth while cushioning downturns with bond stability. The age-based rule says your bond allocation should roughly equal your age. A 30-year-old holds about 30% bonds and 70% stocks. A 60-year-old flips that to 60% bonds and 40% stocks. Some advisors adjust the formula to 110 or 120 minus your age in stocks to account for longer life expectancies, giving younger investors even heavier stock exposure. None of these rules is perfect. Your personal situation, income stability, and other assets all matter. But they provide a sensible baseline.
Diversification is the reason many investors hold both stocks and bonds even when they have a long horizon. Stocks and bonds often move in opposite directions during market stress, so a mix smooths out your returns and reduces the chance of a severe short-term loss. A 100% stock portfolio might deliver higher long-term returns, but it’s also much more likely to suffer a brutal 30–40% drawdown that could derail your plan if it happens at the wrong time. Adding bonds lowers your ceiling but also raises your floor, making it easier to stick with your strategy through rough patches.
Time until you need the money matters. Longer horizons (10+ years) support higher stock allocations. Shorter horizons (0–5 years) call for more bonds or cash. Ability to replace losses counts too. If you have steady income and can keep contributing, you can afford more stock risk. If this is your only nest egg and you can’t rebuild it, lean toward bonds.
Be honest about your emotional comfort with volatility. Will you stay the course when stocks drop 25%? If you’ll panic-sell, a more conservative mix prevents costly mistakes. Consider other sources of stability. A pension or rental income provides bond-like stability, allowing you to take more stock risk in your portfolio. If all your retirement income depends on this account, dial back stocks as you get closer to retirement. And while you shouldn’t try to time the market, extremely high stock valuations or very low bond yields might nudge you to adjust allocations slightly within your overall risk framework.
Final Words
In the action: stocks are ownership with dividends and price gains; bonds are loans that pay interest and return principal.
We walked through risk, returns, time horizons, legal priority, real examples, and simple allocation rules. If you need growth, favor stocks; if you need income or stability, favor bonds. A common rule is 60/40 or matching bond percentage to your age.
Do one thing now: set a small automatic transfer and pick a target split you can stick with. The difference between stocks and bonds is clear enough to build a steady plan. Keep going — it pays off.
FAQ
Q: Is it better to invest in bonds or stocks?
A: The choice between bonds and stocks depends on your goals: pick stocks for long-term growth and higher volatility, bonds for income, lower volatility, and capital preservation. Match your time horizon and risk tolerance.
Q: What is the 7% rule in stocks?
A: The 7% rule in stocks refers to using 7% as a rough long-term average annual return for planning; it’s a rule-of-thumb, not guaranteed. Use it cautiously and adjust for inflation, fees, and your timeline.
Q: Why would someone buy a bond instead of stock?
A: Someone would buy a bond instead of stock because bonds offer predictable interest payments, gentler price swings, and higher legal priority in bankruptcy, so they’re useful for income or short-to-intermediate goals.
Q: Can I make $1000 a month in the stock market?
A: Making $1,000 a month in the stock market is possible but depends on capital, expected return, and risk. For example, $150,000 at 8% yields about $1,000/month; at 3% you’d need roughly $400,000.